MIKE R
Well-Known Member
I feel daft asking this question, but I don't know the answer.
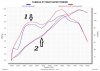
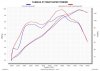
Below is an attachment showing the manufaturer's claimed power gain from the end can.
My basic question is this:-
Which graph represents the claimed increase in torque, and which one the BHP?
Many thanks
Mike
Below is an attachment showing the manufaturer's claimed power gain from the end can.
My basic question is this:-
Which graph represents the claimed increase in torque, and which one the BHP?
Many thanks
Mike
Attachments
-
 45.1 KB Views: 37
") , and the other the Torque. ::001::
, and the other the Torque. ::001::